Data That Tells a Story: How Visual Clarity Transforms Brand Authority
We live in an age of information overload. Every day, the average person is bombarded with thousands of data points, marketing messages, and complex statistics. In this crowded digital landscape, the ability to take a complicated set of numbers and turn them into something instantly understandable is a superpower. Raw data on its own is often cold and uninviting; it requires effort to digest. But when that same data is presented through a clean, well-designed visual, it suddenly gains a pulse. It becomes a narrative that people can connect with, share, and remember.
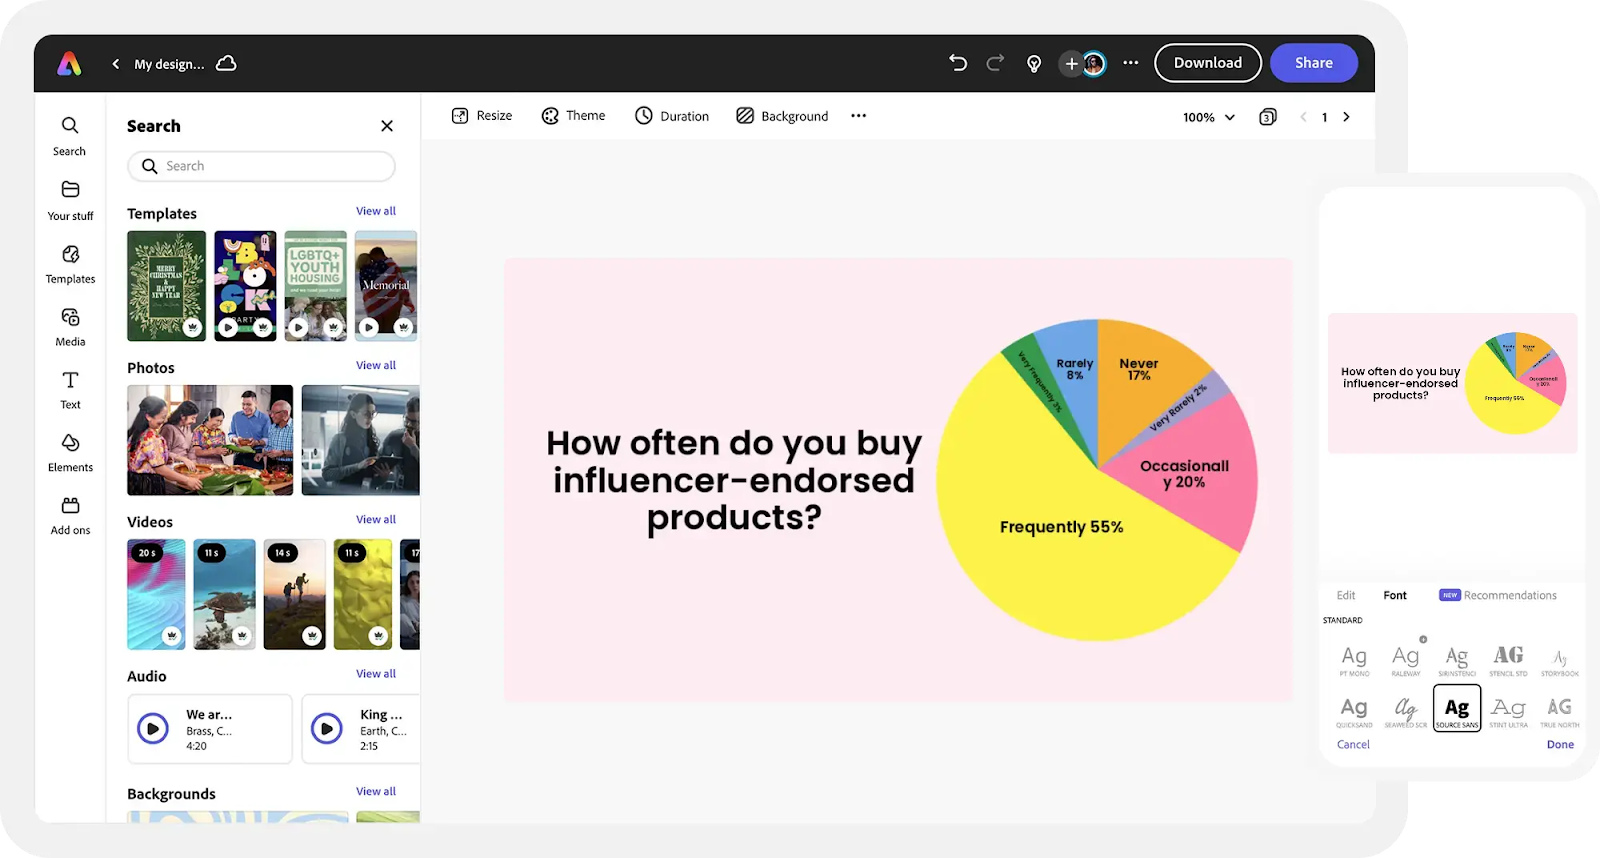
For business owners and content creators, the goal isn’t just to show that you have the facts, it’s to show that you understand them well enough to make them simple for others. Transitioning from a messy spreadsheet to a polished graphic shouldn’t feel like a chore that requires a degree in statistics. To elevate your reports and social media content, you can use Adobe Express’ pie chart maker to boost your brand by turning abstract percentages into vibrant, professional visuals. This shift from “telling” to “showing” is what separates a forgettable brand from an industry authority that people actually trust.
The Psychology of Visual Data
Why are humans so drawn to circular charts and colorful segments? It comes down to how our brains process information. Our eyes are naturally attracted to shapes and colors before they ever settle on text. A well-constructed chart provides an immediate “at-a-glance” understanding of a situation.
When you show a client that 75% of their budget is going toward high-impact activities, they don’t just see a number; they see a visual representation of success. This creates an emotional response. Visuals reduce the cognitive load on your audience, making your message feel more accessible and less like work. In the world of branding, being the person who makes things “easy to understand” is a massive competitive advantage.
3 Rules for Designing High-Impact Charts
Even with the best tools, there is an art to presenting data effectively. If you want your visuals to look like they were created by a high-end agency, keep these three principles in mind:
1. Embrace the “Less is More” Philosophy
The most common mistake in data visualization is trying to show too much at once. If your chart has fifteen different slices, it becomes a confusing rainbow that no one can read. Aim for a maximum of five to six categories. If you have many small data points, group them into an “Other” category to keep the focus on the most significant trends.
2. Color as a Communication Tool
Don’t just pick colors because they look pretty; use them to tell a story. If you want to highlight a specific success, make that slice a bold, primary color while keeping the others in muted tones or grays. This naturally draws the viewer’s eye to exactly where you want it to go.
3. Labeling for Clarity, Not Clutter
Avoid the “Legend Hunt.” Instead of forcing your audience to look back and forth between a color key and the chart, place labels directly next to the slices. This small tweak makes your content significantly more mobile-friendly and easier to digest during a quick scroll.
Real-World Applications for Brand Growth
Data visualization isn’t just for quarterly board meetings. It has a place in every part of your marketing funnel. Here are a few ways to use clear data to build your brand’s reputation:
- Social Media “Truth Bombs”: Share an industry insight that challenges common misconceptions. A simple chart showing the reality of a situation often gets more saves and shares than a standard stock photo.
- Customer Trust Reports: Show your audience exactly how you spend your time or where your materials are sourced. Transparency builds loyalty, and visuals make that transparency feel real.
- Case Study Highlights: Instead of writing three paragraphs about a client’s results, show a “Before and After” breakdown. It’s hard to argue with a visual that clearly shows a massive shift in market share or efficiency.
Mastering the “Human” Side of Numbers
The best data storytellers remember that behind every percentage is a person, a choice, or a result. If you are showing a 10% increase in user engagement, think about what that 10% represents in the real world. Does it mean more time saved for your customers? Does it mean a more vibrant community?
Pair your charts with a human headline. Instead of “Market Share Breakdown 2026,” try something like “Where Our Community is Growing the Fastest.” This adds a layer of personality to your data that prevents it from feeling clinical.
Actionable Tips for Professional Polish
- Consistency is Key: Use your brand’s specific hex codes for your charts. When your data visuals match your website and your business cards, it creates a seamless professional identity.
- Check Your Contrast: Ensure there is enough contrast between the slices and the background. If you’re posting on a dark-themed platform, make sure your labels are bright and legible.
- Keep it Flat: Avoid 3D effects or “exploding” slices unless they serve a very specific purpose. 2D designs are currently the standard for modern, professional aesthetics.
The Path to Authority
In a world full of “experts,” the ones who can distill complexity into clarity are the ones who lead. By taking the time to present your data with intention and style, you aren’t just making a chart; you are building a bridge between your expertise and your audience’s understanding.
Every visual you share is an opportunity to reinforce your brand’s voice and reliability. Start looking at your numbers not as static facts, but as the building blocks of your brand’s next great story.
Would you like me to help you brainstorm some creative ways to visualize your specific industry data for your next social media campaign?